How to Write a Perfect Overview for Academic Task 1
The overview is the single most critical paragraph in your report. Master the two-sentence formula for line graphs, bar charts, tables, and pie charts.

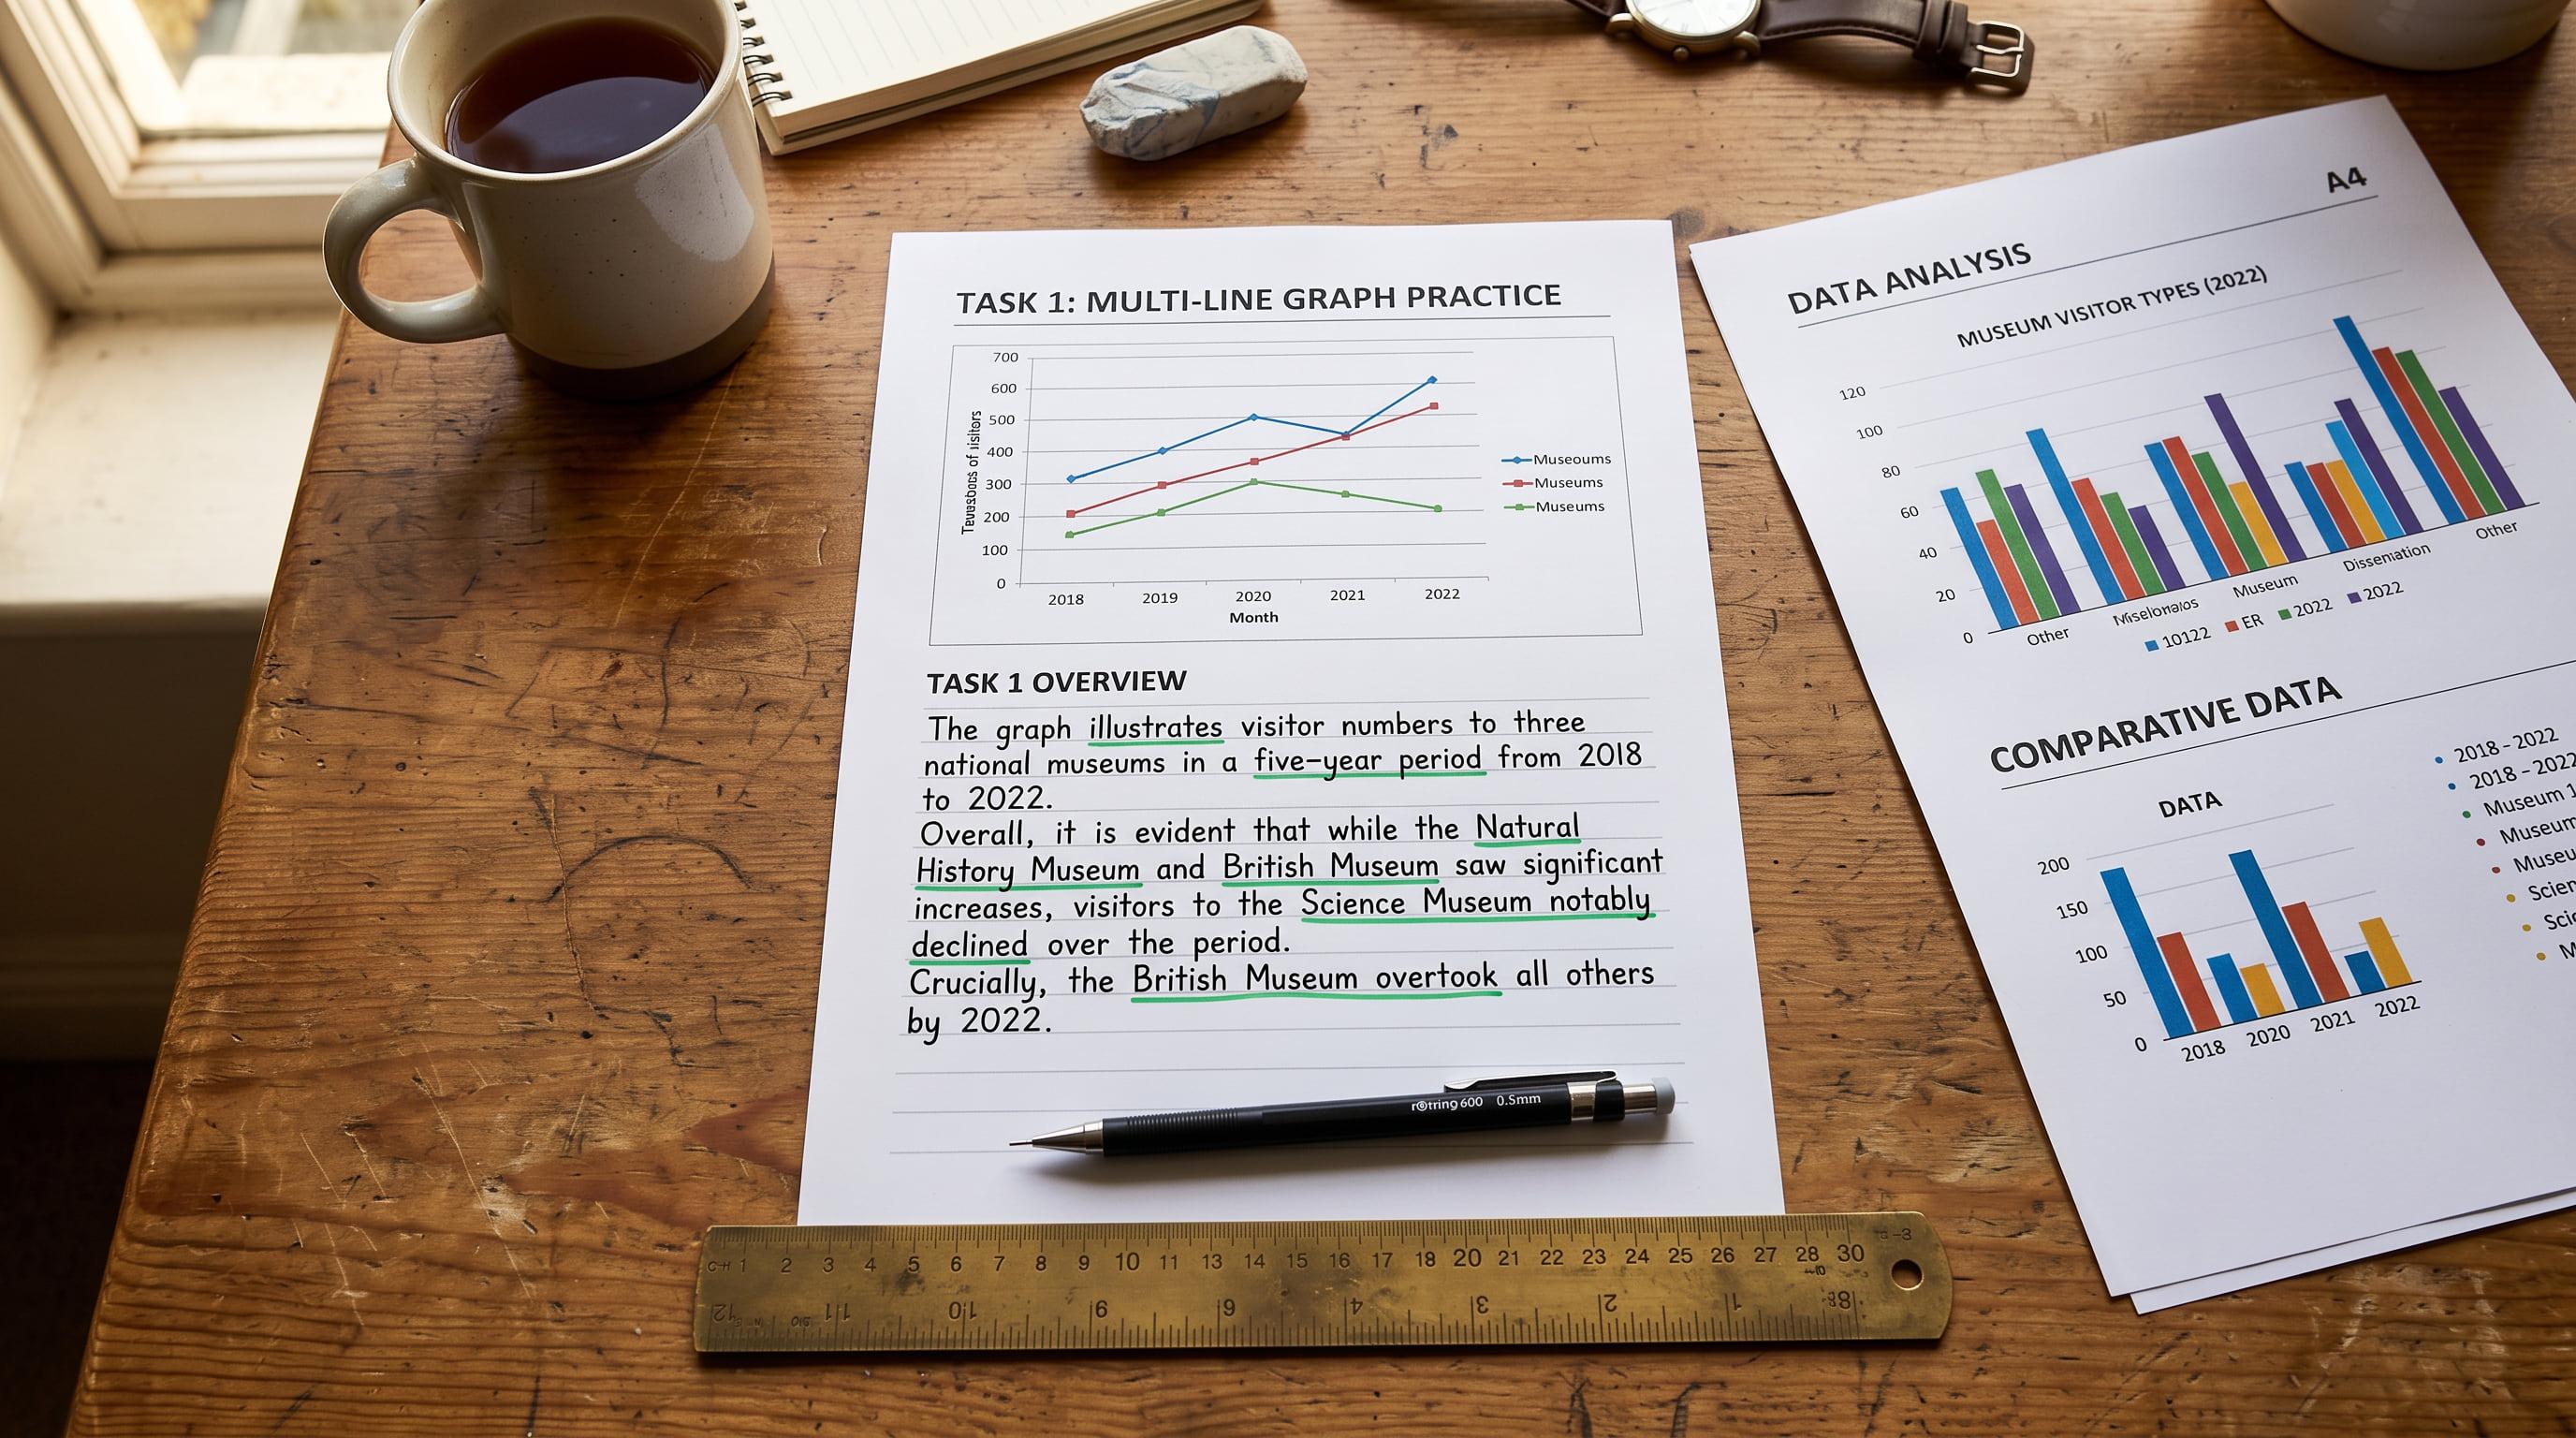
A clear overview of main trends or differences is essential for Band 7+ Task Achievement.
Why the Overview is Critical for Band 7+
In IELTS Academic Writing Task 1, your ability to write a clear, concise, and accurate overview is paramount. It is the single most important paragraph in your report, directly impacting your Task Achievement score. Without a clear overview, your score for Task Achievement is strictly limited to Band 5.0, regardless of how well you describe the details.
The IELTS public band descriptors state that a candidate at Band 7 for Task Achievement "presents a clear overview of main trends, differences or stages." At Band 6, it is merely "an overview with information appropriately selected." To reach Band 7 or higher, your overview must be clear.
Many candidates make the mistake of either omitting the overview entirely, burying it within the body paragraphs, or filling it with specific data points. These approaches prevent you from demonstrating the key skill Task 1 assesses: your ability to identify and report the main features and trends, rather than just listing data.
The Two-Sentence Overview Formula
For data visuals like line graphs, bar charts, tables, and pie charts, a Band 9 overview can almost always be structured into two powerful sentences. This formula ensures you cover the essential aspects without getting bogged down in detail.
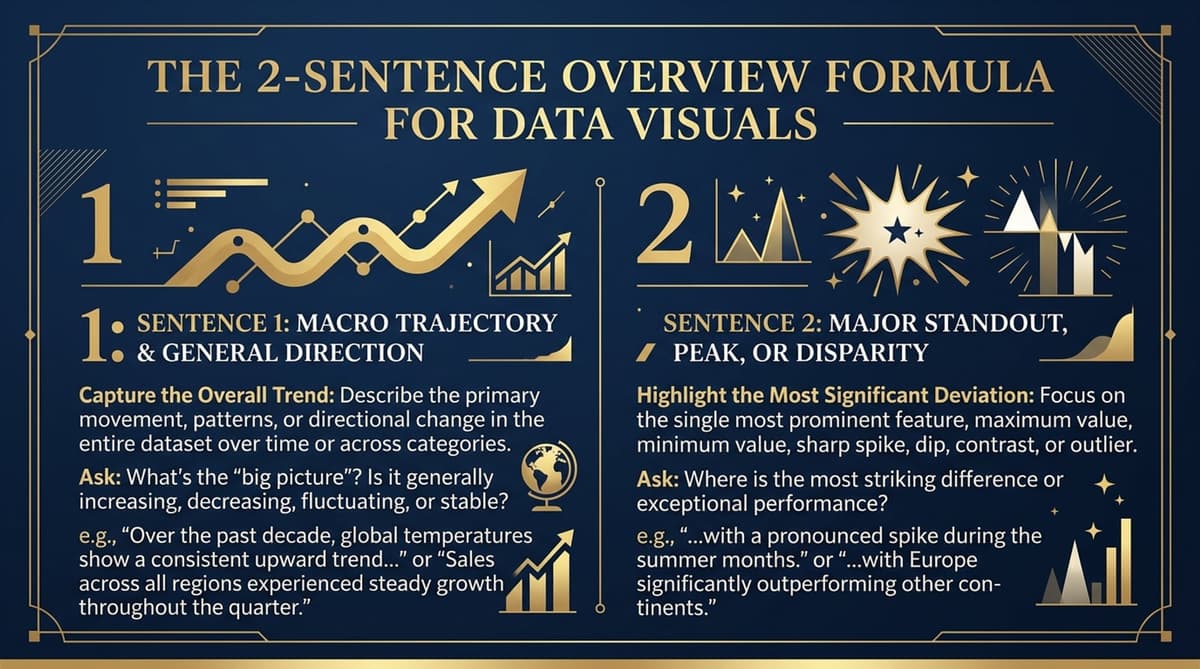
Sentence 1: The Macro Trajectory or General Trend
This sentence should summarise the most significant overall change or trend across the entire period or categories presented. Think big picture: Is there an overall increase, decrease, fluctuation, or stability? What is the dominant movement?
Sentence 2: The Major Standout Feature
This sentence highlights the most striking or noticeable feature. This could be the highest/lowest value, the fastest growth, the most significant difference, or an exception to the general trend. It should be something that immediately catches the eye.
Overview Formula:
Sentence 1: General Trajectory/Overall Trend
Sentence 2: Major Standout Feature/Most Striking Observation
Applying the Formula to Different Data Visuals
The two-sentence formula is versatile and can be adapted for line graphs, bar charts, tables, and pie charts. The key is to understand what constitutes a 'general trajectory' and a 'major standout feature' for each type.
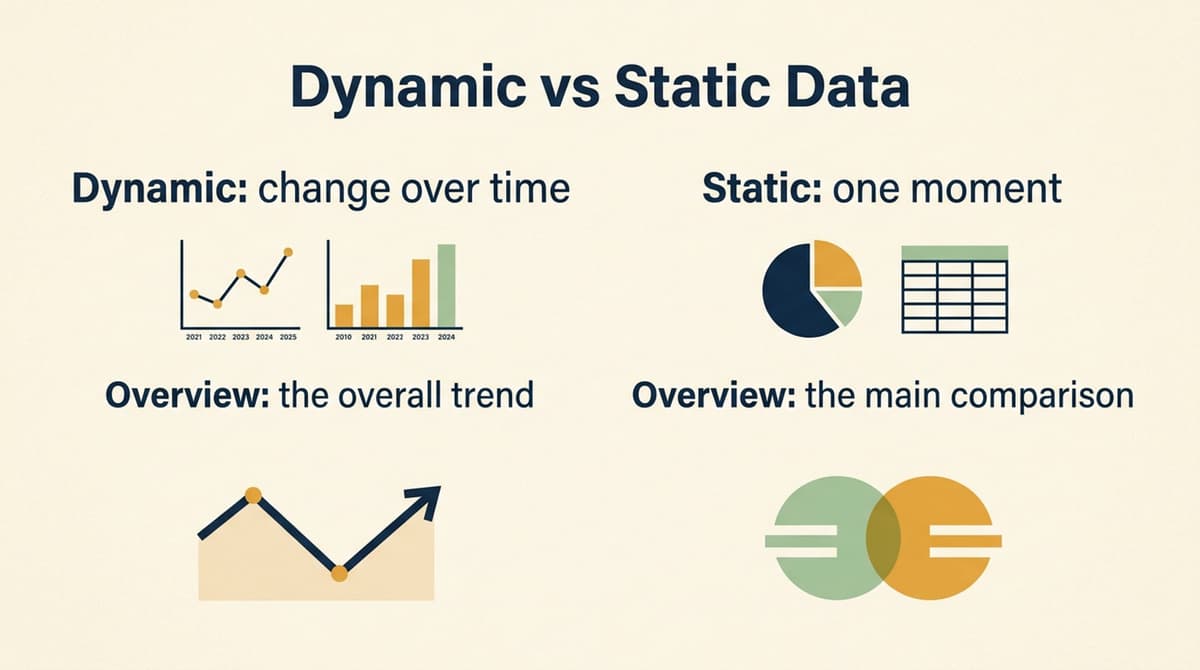
Line Graphs and Bar Charts (Dynamic Data)
These visuals typically show changes over time, making them 'dynamic'.
- Sentence 1 (Macro Trajectory): Focus on the overall movement of the main subjects. Did they generally rise, fall, or fluctuate over the period?
- Sentence 2 (Major Standout Feature): Identify the item with the most dramatic change, the highest/lowest point, or a clear leader/loser throughout the period.
Example: Line Graph
The line graph illustrates the number of visitors to three different museums between 2000 and 2010.
Overview: Overall, visitor numbers to Museum A and C saw a general increase over the decade, while Museum B experienced a decline. Notably, Museum A consistently attracted the highest number of visitors throughout the entire period.
Tables and Pie Charts (Static Data)
These visuals often present data at a single point in time or comparisons between categories, making them 'static'.
- Sentence 1 (General Trend/Comparison): Summarise the main distribution or comparison. Are some categories significantly larger or smaller than others? Is there a clear dominance?
- Sentence 2 (Major Standout Feature): Pinpoint the category with the highest/lowest proportion, the most significant difference, or an unexpected finding.
Example: Pie Chart
The pie chart shows the proportion of different types of energy consumed in a particular country in 2020.
Overview: Overall, fossil fuels accounted for the majority of energy consumption in the country, while renewable sources made up a smaller proportion. It is clear that oil was the most consumed energy type, far exceeding all other categories.
Understanding Dynamic vs. Static Data
The distinction between dynamic (showing change over time) and static (showing a snapshot or comparison) data is crucial for crafting an effective overview. For dynamic charts, your first sentence should focus on the overall movement. For static charts or tables, it should summarise the main distribution or comparison.
The second sentence, the 'standout feature', will then highlight the most significant individual piece of information that supports or exemplifies your general statement.
Avoiding the Data Dump Trap
One of the most common mistakes candidates make is to include specific numbers, dates, or percentages in their overview. This is known as a 'data dump' and it prevents you from demonstrating synthesis and analysis, which are key for higher bands.
Candidate Assumption (Band 5.0)
The overview should list the highest and lowest figures to show I understand the data.
"In 2000, Museum A had 100,000 visitors, which increased to 150,000 in 2010. Museum B started at 80,000 and fell to 40,000."
Band 9 Reality
The overview must summarise general trends and main features without specific data. Details belong in the body paragraphs.
"Overall, visitor numbers to Museum A and C saw a general increase over the decade, while Museum B experienced a decline. Notably, Museum A consistently attracted the highest number of visitors throughout the entire period."
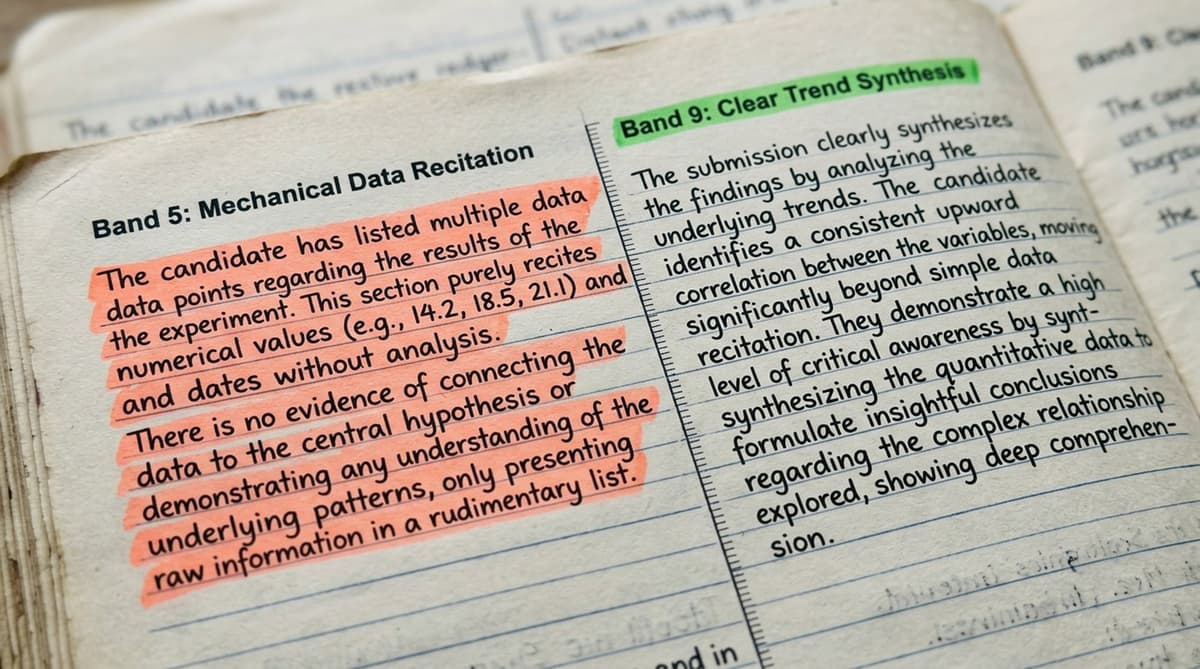
Reciting exact numbers and statistics in the overview is a common trap. This demonstrates a lack of synthesis and will limit your Task Achievement score. The overview is for broad strokes, not fine details.
Remember, the overview is your chance to show the examiner that you can step back and see the forest, not just the individual trees. Save the specific figures and detailed comparisons for your body paragraphs, where you can support your observations with evidence.
Placement of the Overview
While there is no strict rule about where the overview must appear, placing it immediately after your introductory sentence is generally the most effective strategy. This makes it clear to the examiner that you have identified the main features early on, fulfilling a key requirement for higher bands.
An ideal structure for Task 1 is:
- Introduction: Paraphrase the prompt, stating what the visual shows.
- Overview: Your two-sentence summary of the general trend and major standout feature.
- Body Paragraph 1: Detailed description of the first main feature, with supporting data.
- Body Paragraph 2: Detailed description of the second main feature, with supporting data.
Checklist for a Band 9 Overview
Before you finish your Task 1 report, quickly run through this checklist to ensure your overview is perfect:
- Is it present? (Crucial for Band 7+)
- Is it clear and concise? (Typically 2-3 sentences)
- Does it summarise the main overall trends/differences? (The 'big picture')
- Does it highlight the most significant feature? (The 'standout')
- Does it contain ANY specific numbers, dates, or percentages? (It should NOT!)
- Is it positioned early in your report? (Ideally after the introduction)
By consistently applying the two-sentence formula and adhering to these guidelines, you will significantly improve your Task Achievement score in Academic Writing Task 1 and move closer to your target band.

Check yourself
4 questions · about 3 minutes · every answer explained
Was this strategy guide helpful?
Tell us if it helped. It shapes what we write next.
Band 9 Team
Written by the team that builds Band 9.
Candidate Discussion (0)
Join the conversation
Sign in to ask our examiners questions and participate in strategy discussions.
More Writing Strategies
The Process Diagram & Map Blueprint: Scoring Band 9.0 in Academic Task 1 Without Clichés
This masterclass deconstructs the common pitfalls in IELTS Academic Task 1 process diagrams and maps, revealing how to move beyond simplistic sequential descriptions to achieve a Band 9.0. Learn the examiner-approved 3-stage grouping protocol and the art of sophisticated passive voice transitions.
The Concession & Counter-Argument Masterclass: How to Break Through the Band 6.5 Task Response Ceiling
Many IELTS candidates find themselves perpetually stuck at Band 6.0 or 6.5 in Writing Task 2, despite having decent grammar and vocabulary. The culprit? A fundamental misunderstanding of 'development' and 'depth' in Task Response. This masterclass exposes the 'Idea Listing' trap and introduces the indispensable 4-tier concession framework that elevates your argument from superficial to sophisticated, unlocking Band 8.0 and 9.0.